
An introduction to standard deviation: Explained with calculations
The term standard deviation is a wide concept in statistics analysis. It is frequently used to measure the dispersion in the data set. Different forms of statistics used standard deviation to complete their tasks such as confidence interval, hypothesis testing, and coefficient of variation.
In our daily life, standard deviation is used to measure the variability in daily and monthly temperature in weather forecasting. In this post, we are going to explain the term standard deviation along with its definition, types, formulas, and examples.
What is standard deviation?
In statistics, the standard deviation is a measure of the dispersion of a dataset relative to its mean and is calculated by taking the square root of the variance. In descriptive statistics, the standard deviation is defined as the scatter of data points from the expected value (average value).It is denoted by “s or σ” and abbreviated as SD and STD. The variations of the data values are dependent on the standard deviation as the low standard deviation tells the values goes closer to the expected value.
While the high standard deviation tells the values goes far away from the average value. The standard deviation is the positive square root of the variance for sample, population, or probability distribution.
Types of STD
On the basis of datasets, the term standard deviation can be divided into two types.- Population standard deviation
- Sample standard deviation
Population STD
Population standard deviation is a type of standard deviation in which the variability of the whole population is to be evaluated. It is a parameter in which each value of the population data set should be calculated. It is denoted by “σ”The general expression or formula for the population standard deviation is given below.
σ = √ [∑ (xi – µ)2 / N]
- σ = the notation of population standard deviation.
- xi = set of population data values
- µ = population mean of the given population data
- N = total number of observations
Sample STD
Sample standard deviation is the other type of standard deviation in which the variability of some values from the whole population is to be evaluated. It is a statistic in which some sample values from each value of the population data set should be calculated. It is denoted by “s”The general expression or formula for the sample standard deviation is given below.
s = √ [∑ (xi – x̄)2 / (N – 1)]
- s = the notation of sample standard deviation.
- xi = set of population data values
- x̄ = sample mean of the given sample data
- N = total number of observations
Steps to evaluate the STD
Below are some steps that are helpful in calculating the population and sample standard deviation.- First of all, evaluate the sample or population mean of the given data set.
- Find the difference of each data value from the average value.
- Find the square of the differences to make all the calculations positive.
- Add all the squared differences and divide the sum by total number of observations (variance).
- Take square root of the variance.
Example 1: for sample data
Find the variation in the given sample data values.
3, 9, 11, 14, 15, 17, 20, 21, 23, 25, 28, 30
Solution
Step 1: First of all, evaluate the sample mean of the given data set.
Sample data = 3, 9, 11, 14, 15, 17, 20, 21, 23, 25, 28, 30
Sum = 3 + 9 + 11 + 14 + 15 + 17 + 20 + 21 + 23 + 25 + 28 + 30
Sum = 216
Total number of observation = N = 12
Sample Mean = x̄ = 216/12
Sample Mean = x̄ = 108/6 = 18
Step 2: Now find the difference of each data value from the average value and take squares to make all the differences positive.
| Data values | xi - x̄ | (xi - x̄)2 |
| 3 | 3 – 18 = -15 | (-15)2 = 225 |
| 9 | 9 – 18 = -9 | (-9)2 = 81 |
| 11 | 11 – 18 = -7 | (-7)2 = 49 |
| 14 | 14 – 18 = -4 | (-4)2 = 16 |
| 15 | 15 – 18 = -3 | (-3)2 = 9 |
| 17 | 17 – 18 = -1 | (-1)2 = 1 |
| 20 | 20 – 18 = 2 | (2)2 = 4 |
| 21 | 21 – 18 = 3 | (3)2 = 9 |
| 23 | 23 – 18 = 5 | (5)2 = 25 |
| 25 | 25 – 18 = 7 | (7)2 = 49 |
| 28 | 28 – 18 = 10 | (10)2 = 100 |
| 30 | 30 – 18 = 12 | (12)2 = 144 |
∑ (xi - x̄)2 = 225 + 81 + 49 + 16 + 9 + 1 + 4 + 9 + 25 + 49 + 100 + 144
∑ (xi - x̄)2 = 712
Step 4: Now divide sum of squared differences by the degree of freedom (n-1).
∑ (xi - x̄)2 / (n – 1) = 712 / 12 – 1
∑ (xi - x̄)2 / (n – 1) = 712 / 11
∑ (xi - x̄)2 / (n – 1) = 64.73
Step 5: Now take the square root of the above result to evaluate the sample standard deviation.
√[∑ (xi - x̄)2 / (n – 1)] = √64.73
√[∑ (xi - x̄)2 / (n – 1)] = 8.05
The above problem can also be solved online with the help of sample standard deviation calculator.
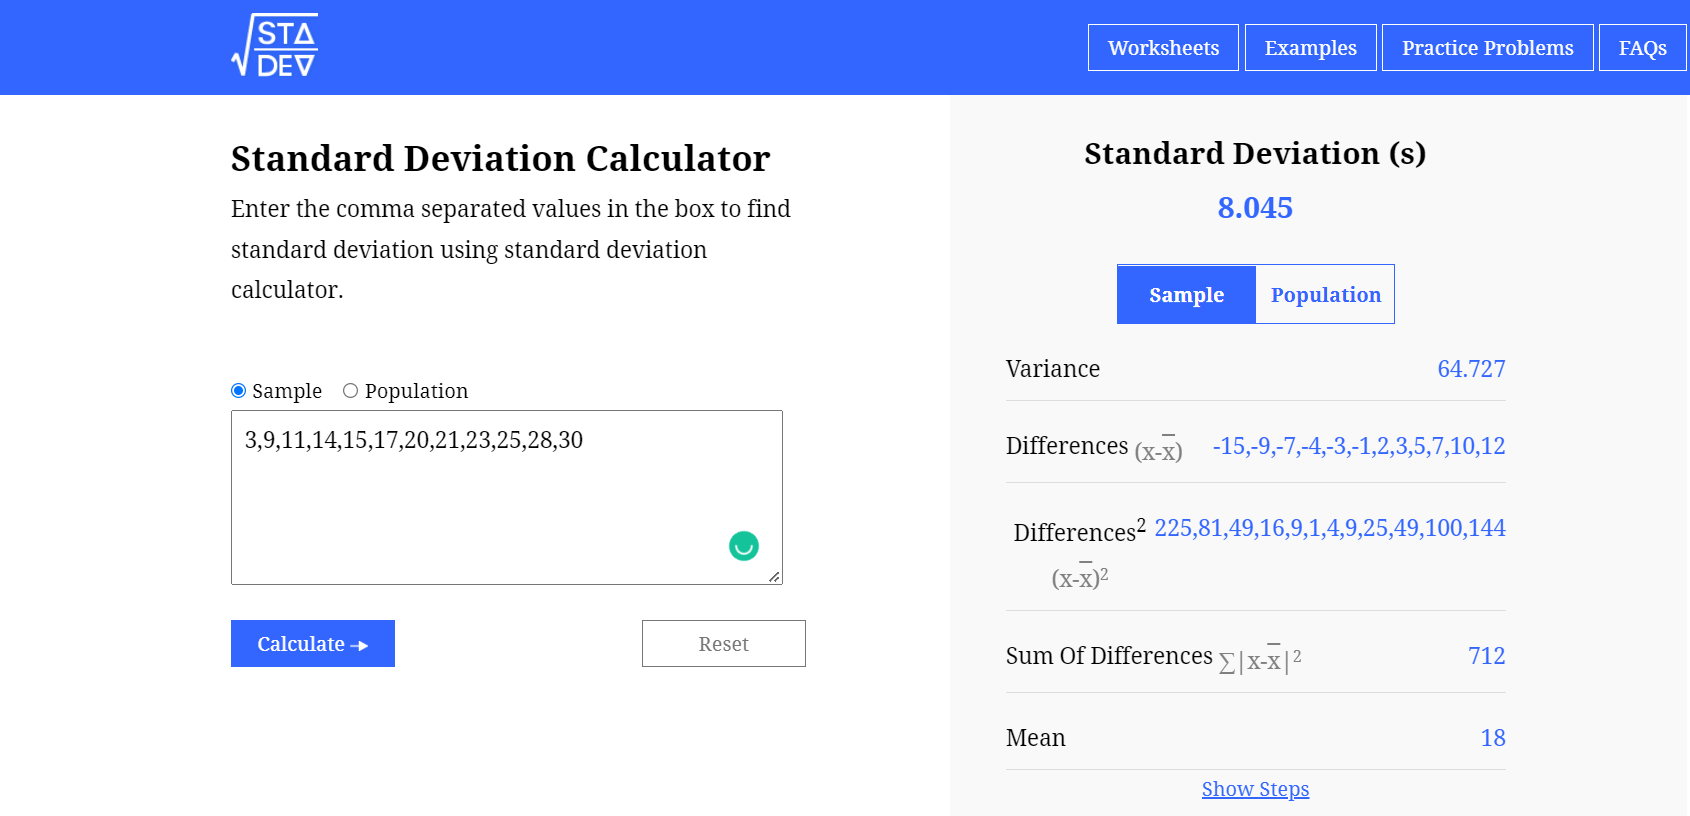
Example calculated by: [https://www.standarddeviationcalculator.io/]
Example 2: for population data
Find the variation in the given sample data values.
1, 3, 5, 7, 9, 11, 13, 15
Solution
Step 1: First of all, take the given population data and evaluate the population mean.
Population data = 1, 3, 5, 7, 9, 11, 13, 15
Sum = 1 + 3 + 5 + 7 + 9 + 11 + 13 + 15
Sum = 64
Total number of observation = n = 8
Population Mean = µ = 64/8
Population Mean = µ = 8
Step 2: Now find the difference of each data value from the average value and take squares to make all the differences positive.
| Data values | xi - µ | (xi - µ)2 |
| 1 | 1 – 8 = -7 | (-7)2 = 49 |
| 3 | 3 – 8 = -5 | (-5)2 = 25 |
| 5 | 5 – 8 = -3 | (-3)2 = 9 |
| 7 | 7 – 8 = -1 | (-1)2 = 1 |
| 9 | 9 – 8 = 1 | (1)2 = 1 |
| 11 | 11 – 8 = 3 | (3)2 = 9 |
| 13 | 13 – 8 = 5 | (5)2 = 25 |
| 15 | 15 – 8 = 7 | (7)2 = 49 |
∑ (xi - µ)2 = 49 + 25 + 9 + 1 + 1 + 9 + 25 + 49
∑ (xi - µ)2 = 168
Step 4: Now divide sum of squared differences by the total number of observations (n).
∑ (xi - µ)2 / N = 168 / 8
∑ (xi - µ)2 / N = 84 / 4
∑ (xi - µ)2 / N = 21
Step 5: Now take the square root of the above result to evaluate the sample standard deviation.
√[∑ (xi - µ)2 / N] = √21
√[∑ (xi - µ)2 / N] = 4.58

Leave a Comment
To post comment, please